Do Older Adults Accurately Forecast Their Social Security Benefits?

Labor Economics
Demography and Aging
Public Economics

Grant M. Seiter and Sita Nataraj Slavov, “Do Older Adults Accurately Forecast Their Social Security Benefits?” Applied Economics Letters 32, no. 2 (2025): 183–187, doi: 10.1080/13504851.2023.2259593.

Authors
Affiliations

University of Virginia

George Mason University & NBER

Published

September 2023

Doi
Other details

Previously circulated as NBER Working Paper 31023 under the same title.

Coverage

Abstract

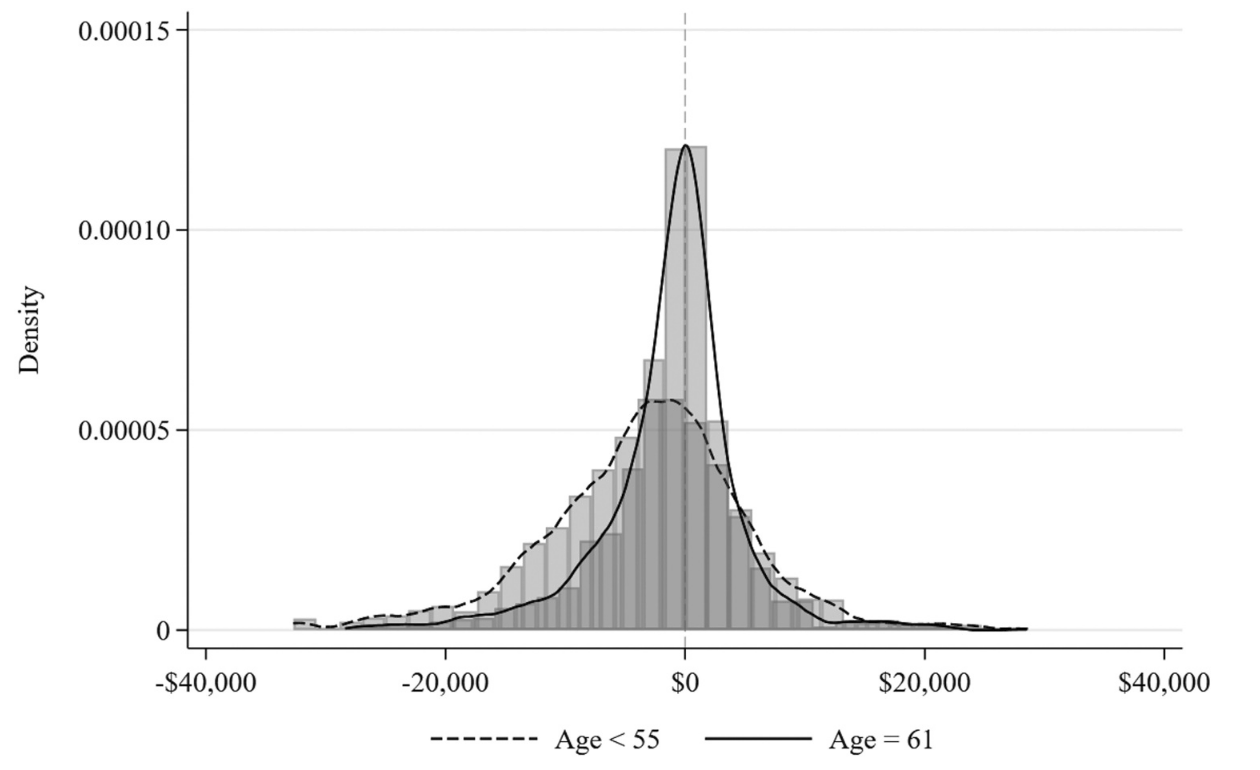
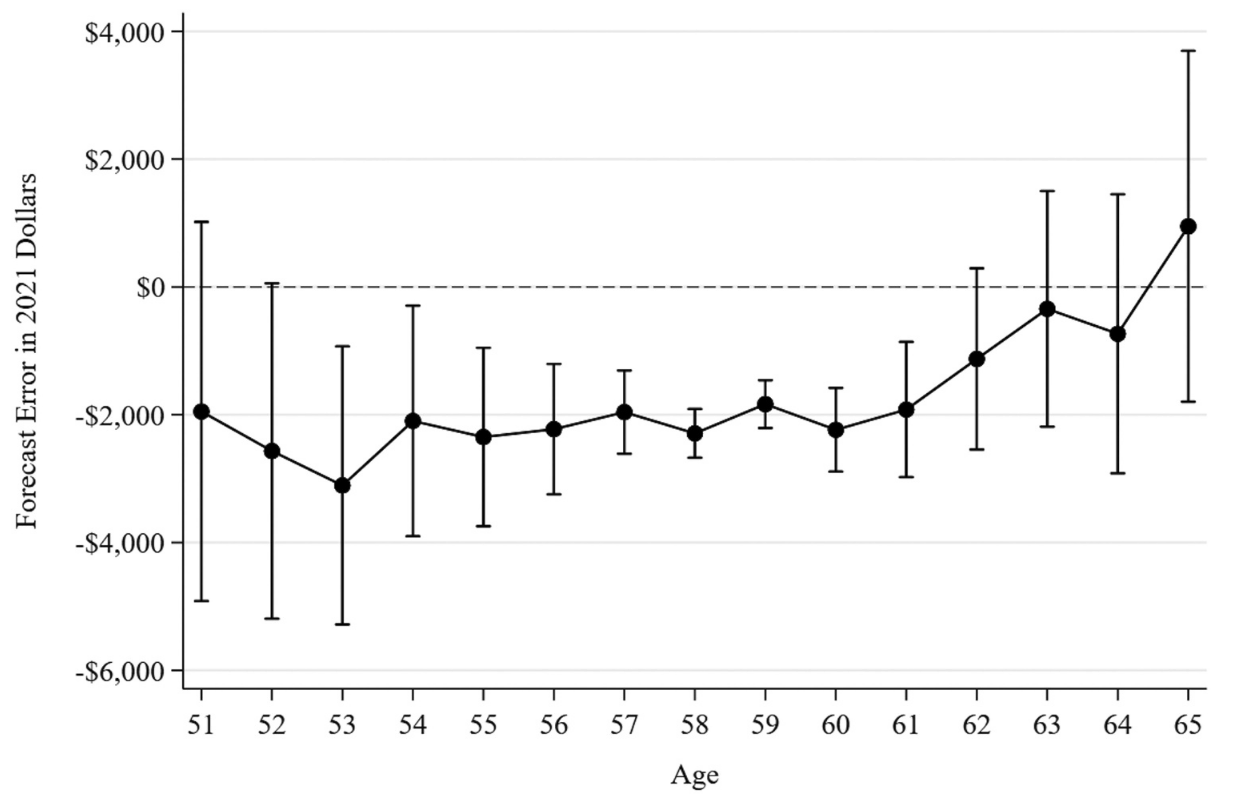
How accurate are older people’s expectations about their future Social Security benefits? Using panel data from the Health and Retirement Study, we compare respondents’ observed Social Security claiming ages and benefits with subjective expectations provided during their 50s and early 60s. We find that, while older adults generally have accurate expectations about their claiming age, they underestimate their annual Social Security income by approximately $1,896 (11.5 percent) on average. However, both accuracy and precision increase with age, and the forecast error for people in their early 60s is not statistically different from zero. Exploiting plausibly exogenous variation in the mailing of Social Security statements, which contain personalized information about future benefits, we show that information provision reduces the forecast error in annual income by $344 (2.1 percent of the average benefit).

JEL Classification

  • E21 Macroeconomics: Consumption; Saving; Wealth
  • H55 Social Security and Public Pensions
  • J14 Economics of the Elderly; Economics of the Handicapped; Non-Labor Market Discrimination
  • J26 Retirement; Retirement Policies

Key Figures

Figure 1: Social Security income forecast error, histogram by age. Notes: Bars represent histograms of Social Security income forecast error for 51–54-year-olds and 61-year-olds. Lines depict Epanechnikov kernel estimates with a $1,000 bin width.

Figure 1: Social Security income forecast error, histogram by age. Notes: Bars represent histograms of Social Security income forecast error for 51–54-year-olds and 61-year-olds. Lines depict Epanechnikov kernel estimates with a $1,000 bin width.

Figure 2: Social Security income forecast error, predictive margins by age. Notes: Dots represent predictive margins of age from Equation (1). Bars represent 95% confidence intervals.

Figure 2: Social Security income forecast error, predictive margins by age. Notes: Dots represent predictive margins of age from Equation (1). Bars represent 95% confidence intervals.

Citation

BibTeX citation:
@article{SeiterSlavov:2025,
    title = {Do Older Adults Accurately Forecast Their Social Security Benefits?},
    author = {Seiter, Grant M. and Slavov, Sita Nataraj},
    year = {2025},
    journal = {Applied Economics Letters},
    volume = {32},
    number = {2},
    pages = {183--187},
    doi = {10.1080/13504851.2023.2259593}
}
For attribution, please cite this work as:
Seiter, Grant M., and Sita Nataraj Slavov. 2025. "Do Older Adults Accurately Forecast Their Social Security Benefits?" Applied Economics Letters 32 (2): 183–187. https://doi.org/10.1080/13504851.2023.2259593.